追記(2017/05/04): gridExtraのwikiのURLが変わっていたので修正しました。
久々にggplot2のIssueを眺めてたら、gridExtraの作者が超有用ドキュメントを書いてるのを見つけたのでメモ。
ちなみに、元はこのIssueで見つけました:
gridパッケージとは
gridパッケージは、デフォルトでインストールされているパッケージで、グラフィカルな出力に関する低レベルな操作ができます。ggplot2とかlatticeはこのシステムを使って作られています。
grid is a low-level graphics system which provides a great deal of control and flexibility in the appearance and arrangement of graphical output. grid does not provide high-level functions which create complete plots. What it does provide is a basis for developing such high-level functions (e.g., the lattice and ggplot2 packages), the facilities for customising and manipulating lattice output, the ability to produce high-level plots or non-statistical images from scratch, and the ability to add sophisticated annotations to the output from base graphics functions (see the gridBase package). (https://stat.ethz.ch/R-manual/R-devel/library/grid/doc/grid.pdf)
いくつか概念の説明があります。
viewport
The key concept for object placeement is that of a viewport: in grid terminology, this represents a rectangular subregion of the display. The default viewport takes up the entire page (device window), and by customising the viewport’s location, size, and even orientation you can arrange a set of plots in just about any way you can imagine. (https://github.com/baptiste/gridextra/wiki/arrange-ggplot)
viewportはディスプレイの一領域を表す概念です。これのサイズを変えたり回転させたり組み合わせたりして、プロットをいい感じに配置します。
Grob
A grid graphical object (“grob”) is a description of a graphical item. These basic classes provide default behaviour for validating, drawing, and modifying graphical objects. Both
grob()andgTree()call the functionvalidDetailsto check that the object returned is internally coherent. (https://stat.ethz.ch/R-manual/R-devel/library/grid/html/grid.grob.html)
viewportが枠だとすれば、Grobはその枠に入る中身です。ひとつのグラフィカルなオブジェクトを表します。gTreeはgrobが複数組み合わさったものみたいです。
(graphical objectだからgrobなんですね。知らなかった…)
gtableパッケージとは
gtableはgrobをテーブル状に整然と並べるパッケージです。たとえばggplot2でグラフを描く時、プロット本体だけでなく軸や凡例やタイトルなど様々な要素がありますが、これをきれいに並べるのにgtableが使われています。
gridExtraパッケージとは
Provides a number of user-level functions to work with “grid” graphics, notably to arrange multiple grid-based plots on a page, and draw tables. (https://github.com/baptiste/gridextra)
gridExtraはそのgtableをさらにラップして、ユーザがgridをいじりたいときに便利な関数を提供します。たとえば、ggplot2に任せてるとfacet_wrap()/facet_grid()しかできないですが、grid.arrange()だと任意のgrobを組み合わせることができます。
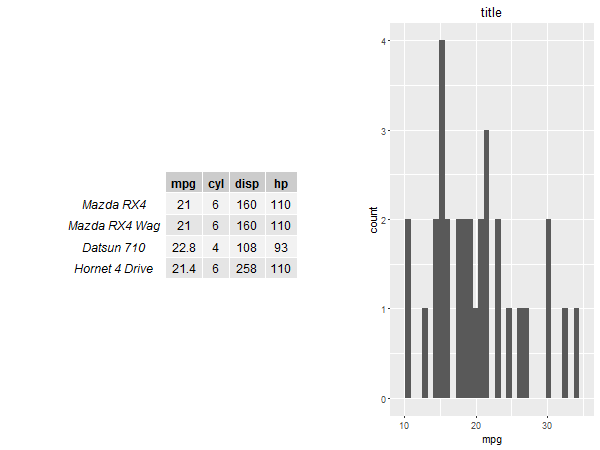
たとえば、件のwikiにはこんな例が載っています。テーブルとグラフを組み合わせられます。(tableGrob()もgridExtraパッケージの関数)
grid.arrange(tableGrob(mtcars[1:4, 1:4]),
             qplot(mpg, data = mtcars) + ggtitle("title"),
             ncol=2, widths=c(1.5, 1), clip=FALSE)

さて、上の例でtableGrob()とqplot()を並列で引数にしているところから察せられるように、ggplotオブジェクトもGrob的なものです。これを知っておくともうちょっと高度なことができるみたいです。
ggplotGrob
ggplotオブジェクトをgrobとして扱うにはggplotGrob()という関数が用意されています(これはggplot2パッケージが提供している関数です)。使ってみましょう。
ggplotオブジェクトの一部だけを抜き出す
このへん:Home · baptiste/gridextra Wiki · GitHub
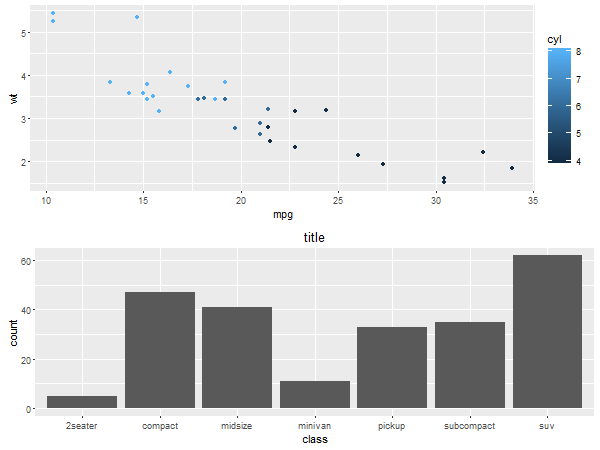
grid.arrange()は単純にプロットを合わせるだけなので、凡例とかの場所をコントロールできません。
p1 <- ggplot(mtcars, aes(mpg, wt, colour = cyl)) + geom_point()
p2 <- ggplot(mpg, aes(class)) + geom_bar() + ggtitle("title")

grid.arrange(p1,p2)

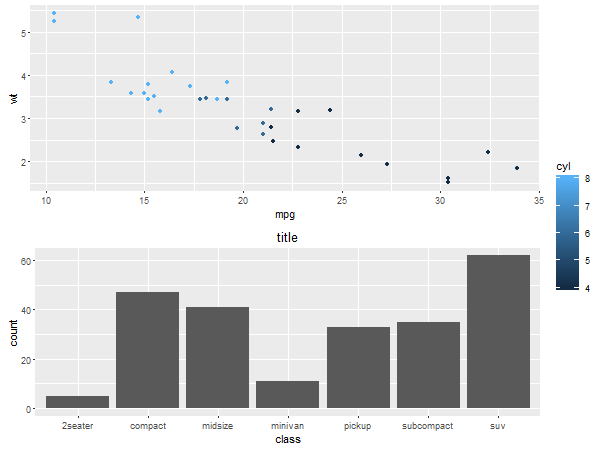
それをいちどgrobにしてしまえば、凡例だけを取り出すこともできます。
g1 <- ggplotGrob(p1)
id.legend <- grep("guide", g1$layout$name)
legend <- g1[["grobs"]][[id.legend]]
lwidth <- sum(legend$width)

grid.arrange(p1 + theme(legend.position="none"),
             p2 + theme(legend.position="none"),
             legend,
             layout_matrix = rbind(c(1,3), c(2,3)),
             widths = unit.c(unit(1, "npc") - lwidth, lwidth))

ggplot2でプロットの中にプロットを描く
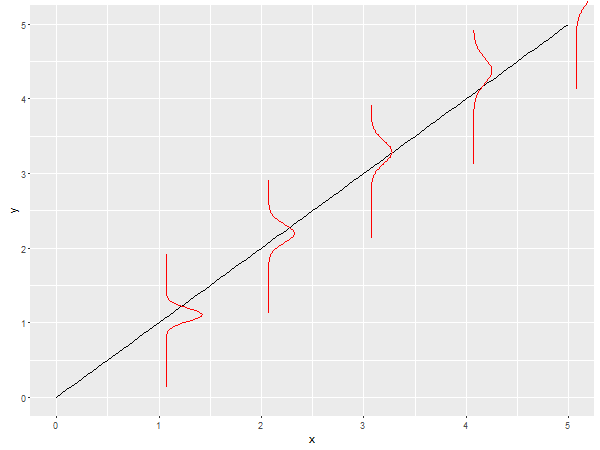
grobはggplot2のannotation_custom()に指定できます。なので、こんなこともできます。(よく分からない例しか思いつかなかったんですがご容赦ください…)
library(purrr)
g <- 1:5 %>%
  map(~ ggplot(data.frame(x = c(-10, 10)), aes(x)) +
      stat_function(fun = dnorm, args = list(mean = ., sd = sqrt(.)), colour = "red") +
      coord_flip() + theme_void() + lims(x = c(-10, 10), y = c(0, 1))) %>%
  map(ggplotGrob)

a <- map2(g, 1:5, ~ annotation_custom(.x, xmin = .y, xmax = .y + 1, ymin = .y - 1, ymax = .y + 1))
ggplot(data.frame(x = c(0, 5)), aes(x)) + stat_function(fun = identity) + a

感想
難しそうなのであまり深入りしないようにしたい。