ggplot2 2.2.0 を使ってみる
追記(2016/11/13): この記事は「ggplot2 2.1.0.9000を使ってみる」として公開していたものです。ggplot2 2.2.0は先日リリースされましたが、この記事を公開して以降レポジトリのNEWS.mdに変更がなかったのでそのままタイトルを変更しました。
公式のアナウンスはこちら。
まだちょこちょこ変更されている印象を受けますが、使ってみます。
Major new features
Subtitle and caption
Thanks to @hrbrmstr plots now have subtitles and captions, which can be set with the
subtitleandcaptionarguments toggtitle()andlabs().
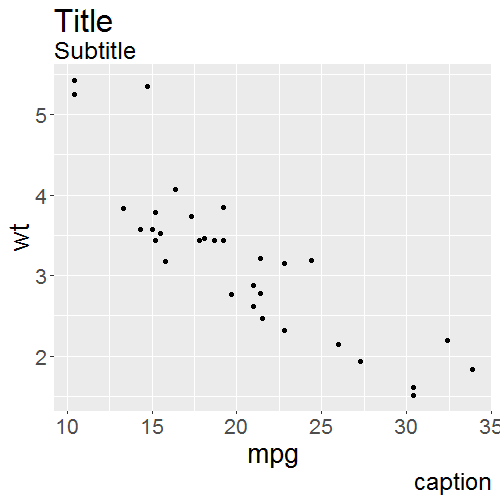
キャプテンアメリカことhrbrmstr氏のおかげで、サブタイトルとキャプションが付けられるようになりました。labs()に、サブタイトルはsubtitle、キャプションはcaptionという引数をそれぞれ指定します。サブタイトルは左上のタイトルの下に、キャプションは右下に表示されます。
library(ggplot2)

p <- ggplot(mtcars, aes(mpg, wt)) + geom_point()

p + labs(title = "Title", subtitle = "Subtitle", caption = "caption") +
  theme(text = element_text(size = 20))

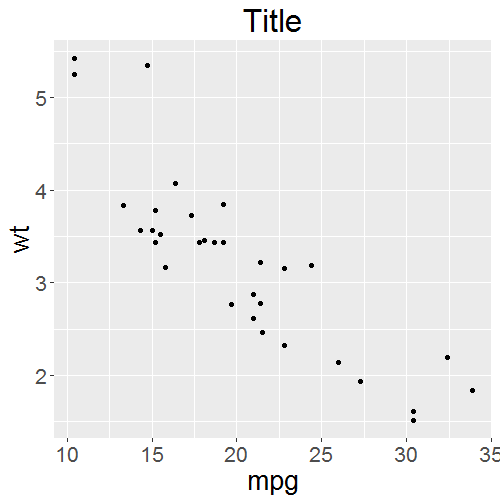
タイトルがデフォルトだと左寄りになったのに注意しましょう。以前の中央寄せに戻したいときはthemeにelement_text(hjust = 0.5)を指定します。ちなみに、サブタイトルのスタイルはplot.subtitle、キャプションのスタイルはplot.captionという引数に指定できます。
p +
  labs(title = "Title") +
  theme(plot.title = element_text(hjust = 0.5), text = element_text(size = 20))

Stacking
position_stack()andposition_fill()now sort the stacking order to match grouping order.
積み上げる順番が凡例と同じ順になりました。これはRStudioのブログに書いてあったのがわかりやすいのでグラフは割愛します。
逆向きにしたいときは、forcats::fct_rev()でfactorの水準を並べ替えるか、position = position_stack(reverse = TRUE)を指定するといいみたいです。
position_stack()andposition_fill()now accepts negative values which will create stacks extending below the x-axis (#1691).
負の値も積み上げられるようになりました。X軸の下に積みあがっていきます。同上の理由でグラフは割愛。
position_stack()andposition_fill()gain avjustargument which makes it easy to (e.g.) display labels in the middle of stacked bars (#1821).
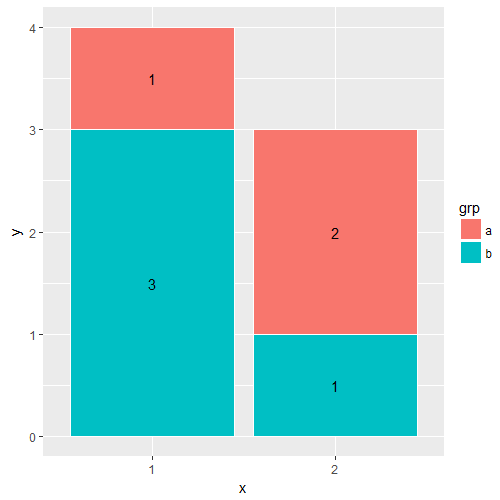
積み上げグラフにラベルを付けるのが簡単になりました。position = position_stack(vjust = 0.5)を指定します。(ここで登場しているgeom_col()については後述)
df <- data.frame(
    x = factor(c(1, 1, 2, 2)),
    y = c(1, 3, 2, 1),
    grp = c("a", "b", "a", "b")
)

ggplot(data = df, aes(x, y, fill = grp, label = y)) +
    geom_col(colour = "white") +
    geom_text(position = position_stack(vjust = 0.5))

Layers
geom_col()was added to complementgeom_bar()(@hrbrmstr). It usesstat="identity"by default, making theyaesthetic mandatory.
これもキャプテンアメリカ作。geom_bar(..., stat="identity")のショートカットです。以下は同じグラフになります。
df <- data.frame(trt = c("a", "b", "c"), outcome = c(2.3, 1.9, 3.2))

# 従来のやり方
ggplot(df, aes(trt, outcome)) +
  geom_bar(stat="identity")

# geom_colを使った場合
ggplot(df, aes(trt, outcome)) +
  geom_col()
When creating a layer, ggplot2 will warn if you use an unknown aesthetic or an unknown parameter. Compared to the previous version, this is stricter for aesthetics (previously there was no message), and less strict for parameters (previously this threw an error) (#1585).
aes()に不要な引数を渡していると警告を出すようになりました。エラーにはならないので実質問題はないと思いますが、issueを見てるとこれ関連の報告がけっこうあるみたいです。
Facetting
The facet system, as well as the internal panel class, has been rewritten in ggproto.
facetもggprotoを使って実装されたので、自分で拡張できるようになりました。詳しくはvignetteを見てくれとのことです。チラ見した感じ、ちょっと難易度高そうな印象でした。
facet_grid()andfacet_wrap()now allow expressions in their facetting formulas (@DanRuderman, #1596).
facet_xxx()に指定するformulaは、これまで変数名しか使えませんでしたが、関数も指定できるようになりました。たとえばissueに載ってたのはこんなやつです。
ggplot(mtcars, aes(qsec, mpg)) +
    geom_point() +
    facet_wrap(~ cut(wt, c(0, 2, 4, 6)))

ggplot2にはcut_number()、cut_width()、cut_interval()という便利関数もあるので、組み合わせて使うと便利そうです。
When
facet_wrap()results in an uneven number of panels, axes will now be drawn underneath the hanging panels (fixes #1607)
facet_wrap()の結果によって軸の目盛りがつかないことがあったけどそれが直ったよ、ということらしいです。詳しくはissueを参照。
Strips can now be freely positioned in
facet_wrap()using thestrip.positionargument (deprecatesswitch).
facet_wrap()の各サブプロットのラベル(これをstripと呼ぶみたいです)の位置を自由に変えられるようになりました。これまではswitch引数でコントロールしていた部分です。(facet_grid()はまだswitch引数を使うみたいです。こっちもstrip.positionでいい気がするけどなぜなのかは不明です。実装上の都合なんでしょうか...)
The relative order of panel, strip, and axis can now be controlled with the theme setting
strip.placementthat takes eitherinside(strip between panel and axis) oroutside(strip after axis).
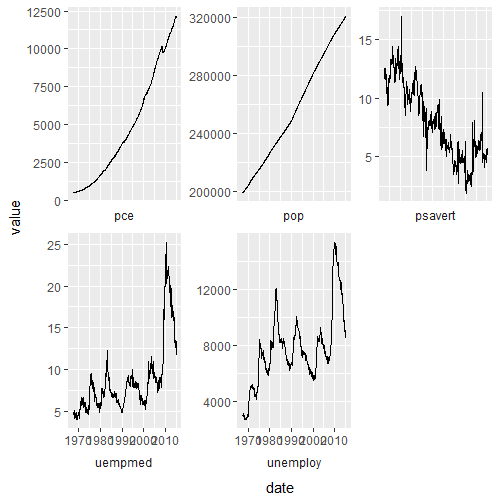
各サブプロットのstripを軸の内側に置くか外側に置くかをコントロールするパラメータです。これをうまく使うと、facet_wrapのヘルプに載っているこんなの↓ができるようになるらしいです。なんか警告が出るけど意味はよく分かりません。
ggplot(economics_long, aes(date, value)) +
  geom_line() +
  facet_wrap(~variable, scales = "free_y", nrow = 2, strip.position = "bottom") +
  theme(strip.background = element_blank(), strip.placement = "outside")
#> Warning message:
#> Suppressing axis rendering when strip.position = 'bottom' and strip.placement == 'outside'

(あとこれ右端のグラフにはX軸出てないけどバグなのかな...scales="free"にすると出ます)
The theme option
panel.marginhas been deprecated in favour ofpanel.spacingto more clearly communicate intent.
オプションの名前が変わったらしいです。
Scales
Continuous scales
scale_x_continuous()andscale_y_continuous()can now display a secondary axis that is a one-to-one transformation of the primary axis (e.g. degrees Celcius to degrees Fahrenheit).
第二軸を表示できるようになりました。これについては別途書いたのでそちらを参照してください:ggplot2 2.2.0で2軸グラフを描くときのメモ - Technically, technophobic.
Scales worry less about having breaks. If no breaks can be computed, the plot will work instead of throwing an uninformative error (#791).
これはなんかよくわからなかったです。2013年のissue...
Scales now warn when transformation introduces infinite values (#1696)
これもよくわからないけど、0が含まれるデータを対数軸にしようとしたときにへんなことになのを直した、ということらしいです。「left as an exercise for the reader」というHadleyのパワーワードとともに残されていた例はこちら:
df <- data.frame(x = c(1e1, 1e5), y = c(0, 100))

ggplot(df, aes(x, y)) +
    geom_point(size = 5) +
    scale_y_log10()
#> Warning message:
#> Transformation introduced infinite values in continuous y-axis
Date time
scale_*_datetime()now supports time zones. It will use the timezone attached to the varaible by default, but can be overridden with thetimezoneargument.
タイムゾーンがサポートされました。指定するのはAsia/Tokyoみたいな形式のタイムゾーンです。指定できるタイムゾーンの一覧はOlsonNames()で見れます。
New
scale_x_time()andscale_y_time()generate reasonable default breaks and labels for hms vectors (#1752).
いい感じの目盛りがつくようになったらしいです。
Discrete scales
The treatment of missing values by discrete scales has been thoroughly overhauled (#1584).
これはr-wakalangでちょっと議論があって私が報告したissueなんですけど、離散値でNAを水準のひとつとみなすか省くかについての議論です。基本的には可能な限りNAも水準のひとつとみなす、という方向になったらしいです。
で、ちょっと注意が必要なのは、na.rmの挙動が変わったことです。
All discrete scales gain a
na.translateargument that allows you to control whetherNAs are translated to something that can be visualised, or should be left as missing. Note that if you don't translate (i.e.na.translate = FALSE)the missing values will passed on to the layer, which will warning that it's dropping missing values. To suppress the warnings, you'll also need to addna.rm = TRUEto the layer call.
geom_xxx()にna.rm=TRUEを指定するのではなくて、scale_x_discrete()などにna.translate=FALSEを指定するようになりました。
つまり、これまでこんな感じで済んでたやつは、
ggplot(df) +
  geom_boxplot(aes(x, y), na.rm = TRUE)
こうなります。
ggplot(df) +
  geom_boxplot(aes(x, y), na.rm = TRUE) +
  scale_x_discrete(na.translate = FALSE)
これはちょっとわかりづらいので、別途解説を書こうと思います。。
Themes
細かい変更っぽいので割愛。
感想
NEWS上はそれほど大きい変更はないですが、内部実装をけっこういじったみたいで、ggplot2に依存するパッケージが動かなくなった、という報告がちらほら上がっています。リリース後しばらくは混乱しそうなので、ちょっと落ち着いてからアップデートするといいかもしれません。