ggplot2 1.0.0を使ってみる
今日はRStudioからいろいろお知らせがありましたが、その中の一つにggplot2が1.0.0になった、というのがありました。
ついに!!!
とかってテンション上がってたんですが、実はGithubのリリースを見ると、v1.0.0がタグ付けされたのは去年の6月とかでした。な、なんと。。RStudioのブログでrecentlyって書いてあったのは、たぶんCRANに上がってきたのが最近っていうことなんでしょうね。
Release ggplot2 1.0.0 · hadley/ggplot2 · GitHub
そんなわけでいまさら感ありますが、知らない機能も多いので触ってみます。
coord_quickmap()
New coordinate system for small scale maps.
coord_quickmap()computes and sets the correct aspect ratio between one degree of latitude and one degree of longitude at the centre of the plotted region.
地図を描く用の関数は既にcoord_map()がありますが、こっちの方がざっくり描画するので速いらしいです。が、手元でベンチマーク取ってみた感じだとあんまり違いが分かりませんでした。。
Issueにもありますが、coord_map()だと横線が入って変になるやつがcoord_quickmap()だとうまく描けたりとか、逆にcoord_map()だとうまくいくのにcoord_quickmap()だとうまく描けなかったりとか(私が試した中ではmap_data("world")とかがだめでした)があるみたいです。奥が深そうなのであまり踏み込まないことにします。
geom_boxplot() - varwidth
geom_boxplotgain newvarwidthargument for controlling whether or not the width of boxplots should be proportional to the size of the groups
geom_boxplot()の横幅をグループのサイズに合わせて変えるかどうか選ぶパラメータです。これは割と便利そう。
ためしにmtcarsでやってみます。
varwidthはデフォルトではFALSEなので、何も指定しないと同じ幅になります。
table(mtcars$carb)
#>
#>  1  2  3  4  6  8
#>  7 10  3 10  1  1
ggplot(mtcars, aes(x = factor(carb), y = mpg)) + geom_boxplot()

varwidthをTRUEにすると、グループのサイズに応じて幅が変わります。
ggplot(mtcars, aes(x = factor(carb), y = mpg)) + geom_boxplot(varwidth = TRUE)

ん? でも幅10と幅1とそんな違わないような…
と思ってヘルプを見ると、平方根に比例するらしいです。なるほど。
if FALSE (default) make a standard box plot. If TRUE, boxes are drawn with widths proportional to the square-roots of the number of observations in the groups (possibly weighted, using the weight aesthetic).
他のgeomの場合
この便利なオプション、geom_bar()とかでも使えないのかなと思いましたが、使えませんでした。代わりにaes()でwidthが指定できます。ここに、例えば..ncount..(ヘルプによればcount, scaled to maximum of 1)のような値を設定するといい感じのグラフになります。
(あんまりいい例を考え付かなかったので適当なグラフですみません)
ggplot(mtcars, aes(x = carb, width = ..ncount..)) + geom_bar(stat = "bin")

この..から始まる特殊な変数はstatの種類によって使えるものが違っていて、各statのヘルプのValueという項目に一覧らしきものがあります。たとえばstat_binだと以下のものが利用可能です。
count: number of points in bindensity: density of points in bin, scaled to integrate to 1ncount: count, scaled to maximum of 1ndensity: density, scaled to maximum of 1
ちなみに、stat_boxplotだとwidthが利用可能で、↓のように明示的にwidthを指定しても同じ結果になります。
ggplot(mtcars, aes(x = factor(carb), y = mpg, width = ...width...)) + geom_boxplot(varwidth = TRUE)
position_jitterdodge()
position_jitterdodge()combinesposition_jitter()andposition_dodge(), allowing the user to plot and align points generated by e.g.geom_point()with those generated by a dodgedgeom_boxplot().
position_dodgeなgeom_boxplot()にgeom_point()を重ね合わせたいとき、というめちゃくちゃニッチな用途のために用意されたものです。
example(position_jitterdodge)の例で試してみると、position_dodge()でもposition_jitter()でもうまくいかないものが、
dsub <- diamonds[ sample(nrow(diamonds), 1000), ]
p <- ggplot(dsub, aes(x = cut, y = carat, fill = clarity)) +
  geom_boxplot(outlier.size = 0)

p + geom_point(pch = 21, position = position_dodge())
p + geom_point(pch = 21, position = position_jitter())


position_jitter()を使うとこの通り!
p + geom_point(pch = 21, position = position_jitterdodge())

...しかしこんなキモいグラフを描く日が来るんでしょうか? まじ疑問。
xlim()/ylim()で範囲を片側だけ指定する
Allow specifying only one of the limits in a scale and use the automatic calculation of the other limit by passing NA to to the limit function,
xlim()orylim()
これは便利そう。いままでだと、原点を0にしたいだけなのにいちいちmax()で最大値を調べながら上限を指定していたわけですが、
wtmax <- max(mtcars$wt)
qplot(mpg, wt, data=mtcars) + ylim(0, wtmax)
いまやNAを渡せば自動で上限を動かしてくれるようになりました。すてき。
qplot(mpg, wt, data=mtcars) + ylim(0, NA)
scale_fill/colour_distiller()
Allow to use brewer palettes for continuous scales, through the new
scale_fill/colour_distiller()functions
colorBrewerの色が連続値についても使えるようになりました。
example(scale_fill_distiller)に書いてあるのを途中までやってみます。
library(reshape2) # for melt
volcano3d <- melt(volcano)
names(volcano3d) <- c("x", "y", "z")
v <- ggplot() + geom_tile(aes(x = x, y = y, fill = z), data = volcano3d)
v
v + scale_fill_distiller()


よくわかりませんが、どちらかといえばscale_fill_distillerの方(下の方)が見やすい気がします。いちおうオプションとして覚えといて損はなさそう。
stat_ellipse()
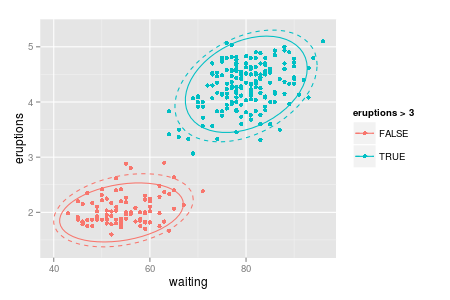
stat_ellipse()adds data ellipses. It supports bivariate normal and t distributions, as well as a euclidian distance circle.
データがだいたい入る(デフォルトだとconfidence levelは95%)円を描いてくれる関数です。typeに"t"を指定するとt分布を、"norm"を仮定すると標準正規分布を仮定します。"euclid"は、データの中心から半径levelsの正円を描きます。
(この辺、用語が正しいか自信がないので、間違っていればツッコミください。。)
ggplot(faithful, aes(waiting, eruptions, color = eruptions > 3)) +
  geom_point() +
  stat_ellipse(type = "norm", linetype = 2) +
  stat_ellipse(type = "t")

theme_linedraw(), theme_light()
Add new themes:
theme_linedraw()is similar totheme_bw()but with truly only white and black elements and spacing between elements identical totheme_gray.theme_lightis similar but with light gray box and axes around the plot, to emphasise content more
新しいテーマ。差が微妙なのでよく分かりません。
見比べたい人はexample(ggtheme)とか打ってみるといいと思います。
theme - panel.margin.x, panel.margin.y
new theme settings
panel.margin.xandpanel.margin.y(units) allow specifying horizontal and vertical gap between panels in facetted plots (for both grid and wrap).
グリッドのマージンをx方向とy方向別々に設定できるようになったよ、と。
vjustの挙動の変更
Fix vertical justification for rotated text. This will change the appearance of plots that use textual elements that are rotated by 90° or 270° and have a
vjustparameter other than the default 0.5; the interpretation ofvjustandhjustis now the same for both rotated and non-rotated text elements (0 = top/left, 1 = bottom/right, 0.5 = centered).
vjustのデフォルト値が変更されるということで、テキストを回転させている人は地味に過去と出力結果が変わるかもしれないので注意。
labeller(), label_wrap_gen()
facet_grid()でグリッドを切ったときのラベルの表示をいじくるためのヘルパー関数的な。
これまでにもfacet_grid()にはlabeller変数はありましたが、labeller()で、それぞれの変数をどう扱うか指定することができるようになりました。
label_wrap_gen()はラベルの文字が長いときに折り返すラベル関数を生成するための関数です。これがあれば、無駄に「=サン」付けをして長くなってしまった変数もスペースで改行してくれます。こんな無駄な例しか思いつかなくてすみません。
a <- mutate(mpg, manufacturer = paste(manufacturer, "=サン"))
p1 <- ggplot(a, aes(cty, hwy)) + geom_point()
p1 + facet_grid(cyl ~ manufacturer, labeller = labeller(
  manufacturer = label_wrap_gen(5), cyl = label_both))

label_wrap_genの中身を覗くと、
function (width = 25)
{
    function(variable, values) {
        vapply(strwrap(as.character(values), width = width, simplify = FALSE),
            paste, vector("character", 1), collapse = "\n")
    }
}
とかいうシンプルな関数だったので、必要なら自前でラベル関数を作ってしまえばいいかもしれません。
aes_q(), aes_string()
New
aes_q()function to generate aesthetic specifications from quoted calls/names.aes_string()uses namesxandyfor first two unnamed arguments.
aes()のcharacterとかquoteとか渡せる版、らしいです。↓が同じ結果になる、と。
aes(col = cyl, fill = NULL)
aes_string(col = "cyl", fill = NULL)
aes_q(col = quote(cyl), fill = NULL)
感想
バージョン1.0.0という割にはあまり変わってなくて、あまり気にせず使い続けられそうでほっとしました。むしろ1.0.0にするのに何をためらってたんだろう、という感じ。
しかしながら、ggplot2って機能が多すぎて、正直何が新しいのかピンとこない新機能もありました。ggolot2 Bookの新版に期待しつつ、勉強しなおしたい気がする今日この頃です。