ggplot2で円を描く
なんかそんな話で微妙にTLが盛り上がっていて、やろうとしたら意外とむずかったのでメモ。
たとえば、こんな感じのよくあるmtcarsのグラフの各点に円を描く場合を考えます。
library(ggplot2)

ggplot(mtcars, aes(wt, mpg)) + geom_point()
geom_pathのリストをつくる
点のまわりにgeom_pathで円を描く関数をつくって、それをpurrr::by_row()で行ごとに適用して、円のリストをつくろうという作戦。
library(ggplot2)

draw_circle <- function(center) {
  theta   <- seq(0, 2, by = 0.01)
  d <- data.frame(x = center$wt + sin(pi * theta),
                  y = center$mpg + cos(pi * theta))
  geom_path(data = d, aes(x, y))
}

circles <- purrr::by_row(mtcars, draw_circle, .collate = "list", .labels = FALSE)$.out
#> [[1]]
#> mapping: x = x, y = y
#> geom_path: lineend = butt, linejoin = round, linemitre = 1, arrow = NULL, na.rm = FALSE
#> stat_identity: na.rm = FALSE
#> position_identity
#>
#> [[2]]
#> mapping: x = x, y = y
#> geom_path: lineend = butt, linejoin = round, linemitre = 1, arrow = NULL, na.rm = FALSE
#> stat_identity: na.rm = FALSE
#> position_identity
#>
#> ...

ggplot(mtcars, aes(wt, mpg)) + geom_point() + circles
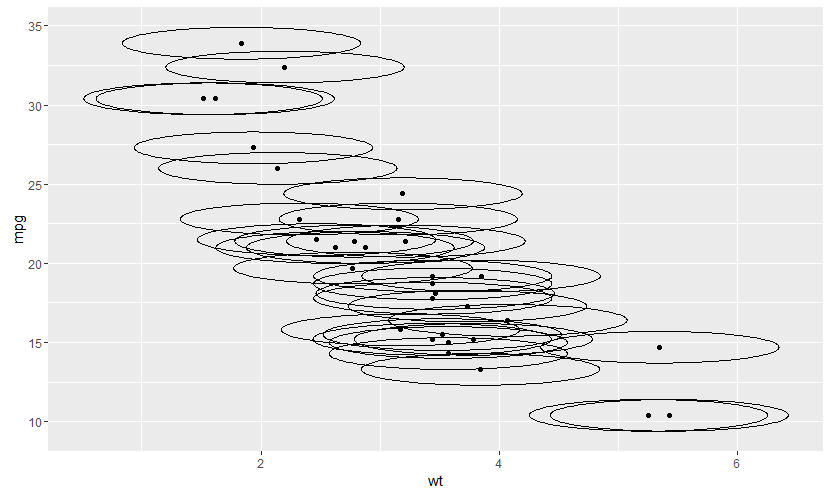
これはうまくいきません。geom_pathで計算した座標も各軸の変形の影響を受けるからです。各軸の変形より前に、Grobにしておく必要があります。
円のggplotGrobをつくってannotate_custom()で適用
ということで、めんどくさいですけど、円のGrobをつくってそれをannotate_custom()で貼り付けていきます。
まずは円を描きます。
theta <- seq(0, 2, by = 0.01)
d <- data.frame(x = sin(pi * theta),
                y = cos(pi * theta))

circle <- ggplot(d, aes(x, y)) +
  geom_path() +
  coord_equal() +       # 縦横比をあわせる
  theme_void()          # 背景を消す

circle
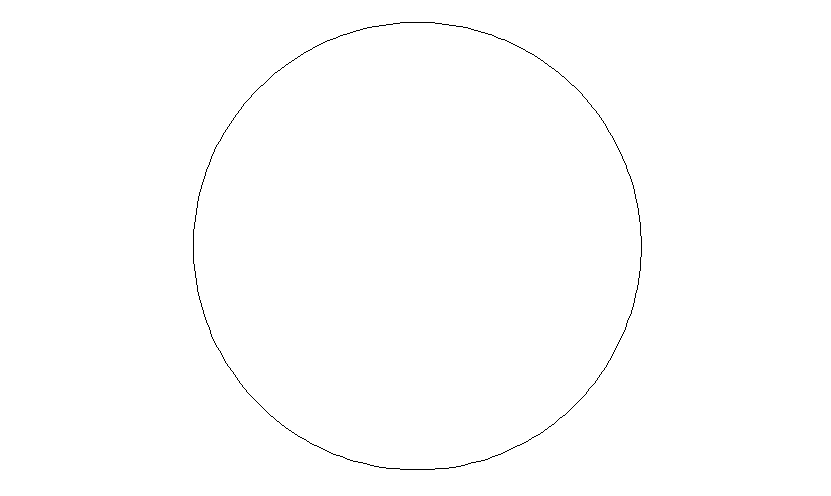
きれいな円になりました。これをggplotGrob()でラップして、各点ごとにannotate_custom()で円を描くようにします。
ggplot(mtcars, aes(wt, mpg)) +
  geom_point() +
  purrr::by_row(
    mtcars,
    ~ annotation_custom(ggplotGrob(circle),
                        xmin = .$wt  - 1, xmax = .$wt  + 1,
                        ymin = .$mpg - 1, ymax = .$mpg + 1)
  )$.out
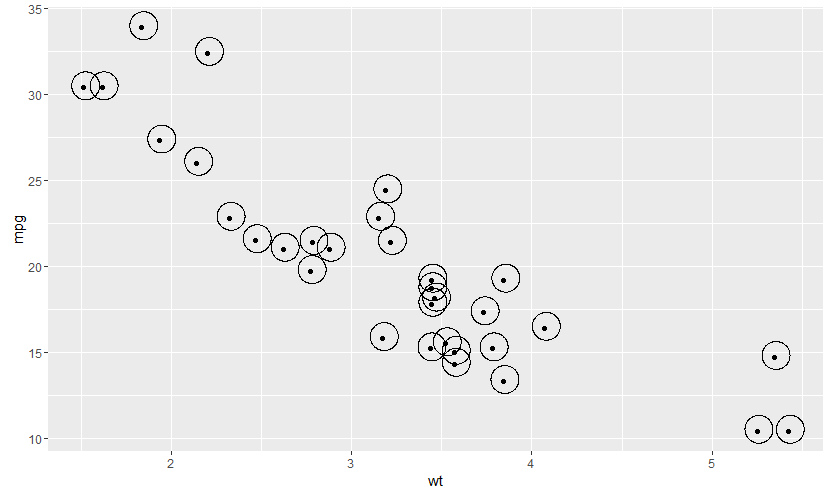
うまくいきました。
geom_pointを使う
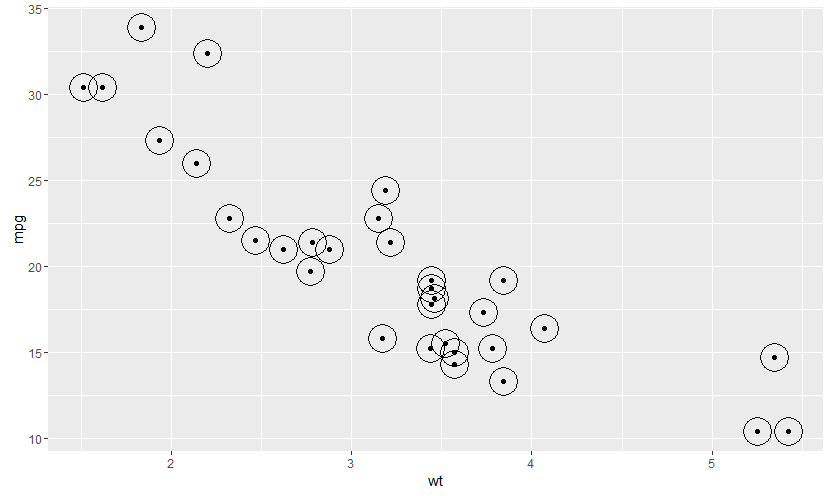
実は円を描くだけなら、geom_pointのshape 21を使うとできます。
Note that shapes 21-24 have both stroke
colourand afill. The size of the filled part is controlled bysize, the size of the stroke is controlled bystroke. (https://github.com/hadley/ggplot2/blob/master/vignettes/ggplot2-specs.Rmd)
ggplot(mtcars, aes(wt, mpg)) +
  geom_point() +
  geom_point(size = 10, fill = "transparent", colour = "black", shape = 21)
annotate_customだと色々遊べる
ということで、こんなに苦労する必要あるのか分からないんですけど、annotate_custom()はGrobならなんでも大丈夫なので、自由度が高いです。こんな変な図形とか書きたくなった時も、
theta <- seq(0, 4, by = 0.01)
linelen <- (1 + 0.5 * sin(25 * pi * theta))
d <- data.frame(x = linelen * sin(7 * pi * theta),
                y = linelen * cos(7 * pi * theta))
circle <- ggplot(d, aes(x, y)) + geom_path() + coord_equal() + theme_void()

circle

ggplot(mtcars, aes(wt, mpg)) +
  geom_point() +
  purrr::by_row(
    mtcars,
    ~ annotation_custom(ggplotGrob(circle),
                        xmin = .$wt  - 1, xmax = .$wt  + 1,
                        ymin = .$mpg - 1, ymax = .$mpg + 1)
  )$.out
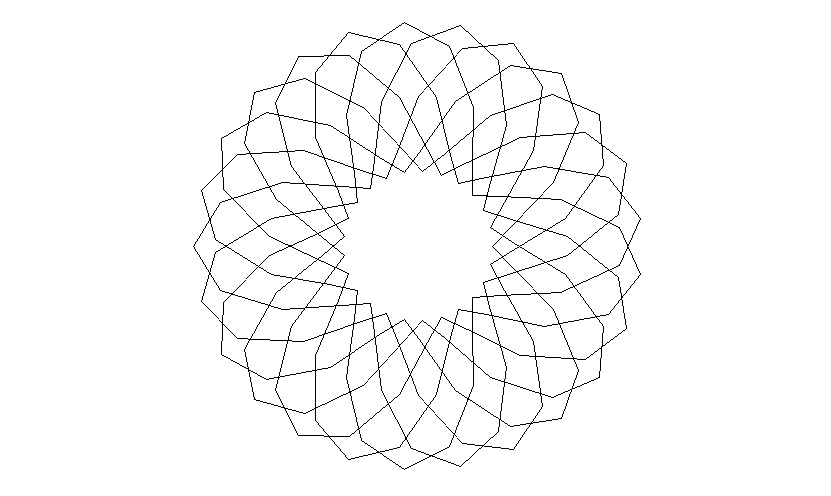
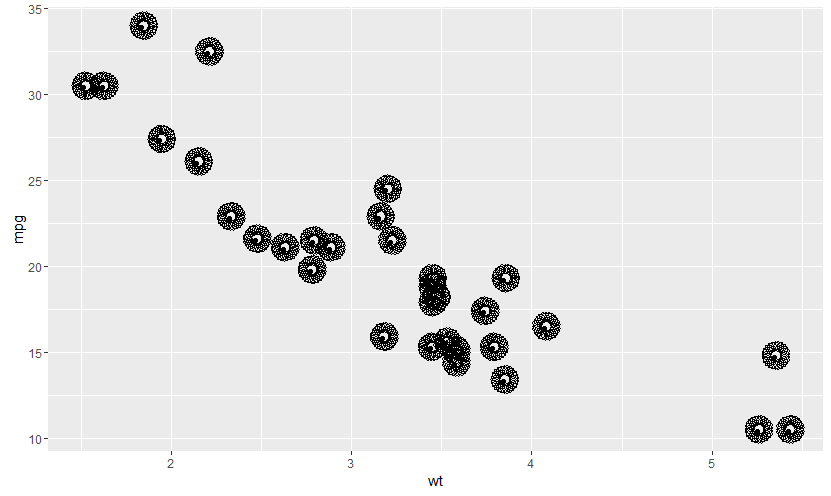
という感じでできます。…これはなんか気持ち悪いだけですけど。
以上、メモでした。