ggplot2のgenerated variables(..変数名..)の使い方
追記(2020/1/7): ..変数名..という書き方はもう古くて、version 3.0.0でstat()になり、version 3.3.0 からはafter_stat()になります。
StackOverflowとかを見てると、たまにタツジン級のggplot2使いが謎の..変数名..というのをaes()に指定していることがあります。
こういうの、見たことあるでしょうか?
ggplot(diamonds, aes(price)) +
  geom_histogram(aes(y = ..density..), binwidth = 500)
この..変数名..という書き方は、ggplot2がグラフを描くために内部的に計算する値にアクセスする方法です。ggplot2 bookで言うと、このあたりに書かれています。
ggplot2が内部的に計算する値
たとえば、ヒストグラムを描く場合を考えます。
ggplot(diamonds, aes(carat)) + geom_histogram()

当たり前ですが、渡された値そのままではヒストグラムを描けません。ggplot2は、内部で「区間ごとに個数を数える」といった計算をしています。
計算された値を見てみましょう。ggplot_build()はggplot2がグラフを描画する前に呼び出される関数で、設定に基づいて計算を実行します。(この辺の流れは1年ほど前にブログに書きました。興味があればどうぞ:ggplot2のコードをなんとなく追ってみつつ自作パッケージの方針を練る - Technically, technophobic.)
p <- ggplot_build(ggplot(diamonds, aes(x = carat)) + geom_histogram())

#> names(p)
#> [1] "data"  "panel" "plot"

dplyr::glimpse(p$data[[1]])
#> Observations: 33
#> Variables: 17
#> $ y        (dbl) 0, 8292, 9337, 7340, 6442, 3356, 8240, 3639, 987, 3059, 909, 157...
#> $ count    (dbl) 0, 8292, 9337, 7340, 6442, 3356, 8240, 3639, 987, 3059, 909, 157...
#> $ x        (dbl) 0.08016667, 0.24050000, 0.40083333, 0.56116667, 0.72150000, 0.88...
#> $ density  (dbl) 0.0000000000, 0.9587922825, 1.0796241608, 0.8487138632, 0.744879...
#> $ ncount   (dbl) 0.0000000000, 0.8880796830, 1.0000000000, 0.7861197387, 0.689943...
#> $ ndensity (dbl) 0.0000000000, 0.8880796830, 1.0000000000, 0.7861197387, 0.689943...
#> $ PANEL    (int) 1, 1, 1, 1, 1, 1, 1, 1, 1, 1, 1, 1, 1, 1, 1, 1, 1, 1, 1, 1, 1, 1...
#> $ group    (int) -1, -1, -1, -1, -1, -1, -1, -1, -1, -1, -1, -1, -1, -1, -1, -1, ...
#> $ ymin     (dbl) 0, 0, 0, 0, 0, 0, 0, 0, 0, 0, 0, 0, 0, 0, 0, 0, 0, 0, 0, 0, 0, 0...
#> $ ymax     (dbl) 0, 8292, 9337, 7340, 6442, 3356, 8240, 3639, 987, 3059, 909, 157...
#> $ xmin     (dbl) 0.0000000, 0.1603333, 0.3206667, 0.4810000, 0.6413333, 0.8016667...
#> $ xmax     (dbl) 0.1603333, 0.3206667, 0.4810000, 0.6413333, 0.8016667, 0.9620000...
#> $ colour   (lgl) NA, NA, NA, NA, NA, NA, NA, NA, NA, NA, NA, NA, NA, NA, NA, NA, ...
#> $ fill     (chr) "grey20", "grey20", "grey20", "grey20", "grey20", "grey20", "gre...
#> $ size     (dbl) 0.5, 0.5, 0.5, 0.5, 0.5, 0.5, 0.5, 0.5, 0.5, 0.5, 0.5, 0.5, 0.5,...
#> $ linetype (dbl) 1, 1, 1, 1, 1, 1, 1, 1, 1, 1, 1, 1, 1, 1, 1, 1, 1, 1, 1, 1, 1, 1...
#> $ alpha    (lgl) NA, NA, NA, NA, NA, NA, NA, NA, NA, NA, NA, NA, NA, NA, NA, NA, ...
元のデータにはxしか与えていませんが、計算された値がいろいろ増えていることが分かると思います。
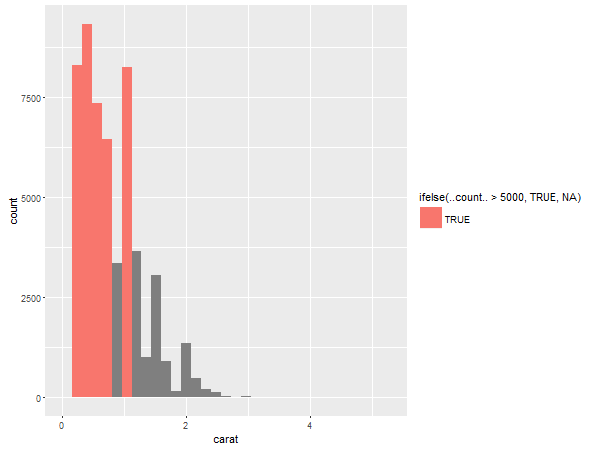
この中でcountがヒストグラムで使われるものです。これを使うと、たとえば、個数が5000以上の区間の色を変える、といったことができます。
ggplot(diamonds, aes(x = carat)) +
  geom_histogram(aes(fill = ifelse(..count.. > 5000, TRUE, NA)))

他のgeomで使ってみる
行われる計算は、geomではなくstatの種類によって決まります。この計算はgeom_histogramのデフォルトのstat、stat_binに規定されているものです。つまり、他のgeomでもstat="bin"を指定すると同じ値が使えます。
たとえば、以下のようにgeom_text()にstat="bin"を指定すると値のラベルをつけることができます(Hadleyは怒りそうですけど)。
ggplot(diamonds, aes(x = carat)) +
  geom_histogram(aes(fill = ifelse(..count.. > 5000, TRUE, NA))) +
  geom_text(aes(y = ..count.. + 150, label = ..count..), stat = "bin")

ちなみに、計算された値をなんでも指定できるわけではありません。たとえば、..count..がいけるなら..y..も大丈夫だろう、と思って使うとエラーになります。
ggplot(diamonds, aes(carat)) +
  geom_histogram(aes(fill = ifelse(..y.. > 5000, TRUE, NA)))
#> Error in ifelse(y > 5000, TRUE, NA) : object 'y' not found
generated variablesの調べ方
各statでどの変数にアクセスできるのかは、ヘルプに書かれています。
まず、使われているstatの種類を調べます。各geomのデフォルトのstatが何なのかは、geomのヘルプを見れば書いてあります。例えば、geom_histogramのヘルプのUsageを見ると、以下のようになっています。ばっちりstat="bin"になっていますね。
geom_histogram(mapping = NULL, data = NULL, stat = "bin",
  binwidth = NULL, bins = NULL, origin = NULL, right = FALSE,
  position = "stack", show.legend = NA, inherit.aes = TRUE, ...)
次に、stat_binのヘルプを見ます。Valuesという項目が..変数..の書き方でアクセスできる変数の一覧です。
count
        number of points in bin

density
        density of points in bin, scaled to integrate to 1

ncount
        count, scaled to maximum of 1

ndensity
        density, scaled to maximum of 1
※ちなみに、Github版のggplot2であれば、geomと同じヘルプページにstatもまとまっています。「Computed Values」という項目があるのでそこを見ましょう。
(generated variablesの一覧をつくった話は昔ブログに書きました。これも興味があればどうぞ:ggplot2で指定できるgenerated variableの一覧 - Technically, technophobic.)
注意点
この方法でアクセスできる変数は、ggplot2内部で計算される値です。これは、グラフを描画するたびに計算しなおされるので非効率です。大量のデータに複雑な計算をする場合は、statに頼らずdplyrとかを駆使して自分でやることを検討しましょう。